Jira in enterprise companies: person days, lead/cycle time and finance reporting
One morning my product director walked up to my desk and said we would be sending finance a report every month. I said two day job. By the end of the third day I knew better.
Also available in Turkish This post is a translation.
Contents
- The problem was not really Jira
- First I drew the tree
- The first link I built was the wrong one
- Where would the person days come from
- I started with 22 days a month, and it did not hold
- The report’s real job started in November
- I read the durations out of the changelog
- Looking only at closed work misled me
- Finance’s three questions came out of the same data
- The report did not agree with payroll
- What we actually built inside Jira
- Not one report, two
- What I call mistakes looking back
- How it ended
I was doing product management in retail, at the point where e-commerce and physical stores meet. On the technology side we had nine teams: mobile, payments, data, store systems, a few more.
One morning my product director walked up to my desk. “From now on we send finance a report at the start of every month,” he said. “They want to see which project closed in which month, and how much was spent in each status on each project.”
Then came the rest of it: “Everything is already in Jira, you can pull it out.”
I said “two day job”. By the end of the third day I knew I was wrong.
Because what he was asking for was not one report, it was two. It took me a few days just to tell them apart.
The status breakdown was our own problem. Why did this take six weeks, how much of those six weeks went into analysis, how long did it sit in testing. IT was the one asking that, and the answer was about how the teams worked.
Finance cared about exactly one thing: how many person days went into which project. The name of the status meant nothing to them. For them a project was a line that effort gets written against, and effort turns into money.
Both reports would come out of the same data. And to come out of it, they had to sit on the same tree. That was the whole difficulty.
Jira held more than ten thousand issues for that year. The teams worked in a steady rhythm, sprints closed, nothing was broken. And yet “how many person days went into the payment page redesign last month” had no answer on any screen. Jira’s own reports gave me velocity, burndown, cumulative flow; none of it answered the question finance was asking. There were paid add-ons on the Marketplace, but our procurement process would have taken longer than the deadline for the first report.
So one weekend I sat down and wrote a small script that pulled issues and their status history out of the REST API. The code was the easy part. The hard part was deciding what that code should add up.
This piece is the story of those decisions. The structure is real; the issue keys, team names and numbers stand in for the originals.
The problem was not really Jira
I worked that out on day one. Jira is not an accounting tool, it is a work tracking tool. The problem was that work tracking and finance were not standing on the same tree.
Two separate languages were spoken in the company, and they never met on their own.
Finance spoke in projects, or investment items in their own wording. There is a line called “Loyalty programme rebuild”; it has a budget, it has an owning department, and how much of it gets consumed during the year is tracked. That line is opened once and lives for eighteen months.
The teams spoke in tasks. A backend developer’s week goes into an issue called “idempotency check on the points service”. That issue lives three days, closes, and a new one takes its place.
There are two or three levels in between, and until those levels are filled in, nobody can match the line above with the effort below.
Until then, Excel was closing that gap. At the end of the month someone sat down, asked the team leads, wrote estimated percentages, and sent the file to finance. The file was not wrong, but it was not auditable either. I asked my director where the 35% in last month’s file came from, and the answer was very clear: “Nobody knows. That is exactly the problem.”
First I drew the tree
Before writing any code I drew four layers on a whiteboard. Companies name the layers differently, the logic does not change.
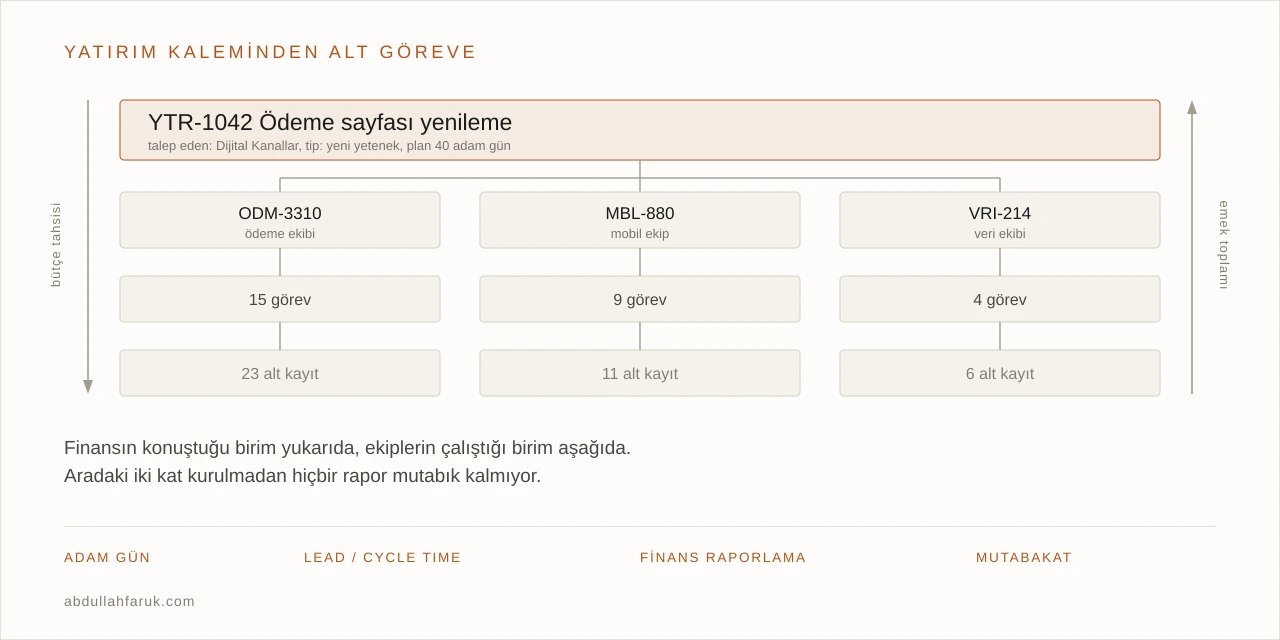
First layer, the investment item. What finance calls a project, and the only line it sees in the report. It lives in its own Jira project, ours was called YTR. Something like YTR-1042 Payment page redesign. The owner is a product or programme manager, not a developer. It carries the requesting department, the investment type, the target quarter and the planned budget. It never enters a sprint, never takes story points, never gets assigned to anyone.
Second layer, development epics. An investment item is never one team’s job. Under YTR-1042 there is one epic from the mobile team, two from payments, one from data. Each sits in its own team’s project: ODM-3310, MBL-880, VRI-214. I never even tried to pull nine teams into a single project; it would have cost me three months and nobody would have agreed anyway. This layer is where an investment spreads across teams.
Third layer, tasks. Where effort is actually spent. Estimates go here, work is recorded here, and status history means something here. An epic can hold fifteen tasks.
Fourth layer, subtasks and bugs. The layer people usually skip. Testing, fixes and rework under a task live here. Keeping this layer separate mattered, because it is the only place you can see how much of a piece of work was rework. Dissolve the bug inside the parent task and the cost of quality evaporates.
When the drawing was done there were also two arrows on the board, and those two arrows gave me the real idea. Budget is allocated top down, effort rolls up bottom up. The amount set aside for YTR-1042 is decided at the top, but what that item actually consumed is the sum of the issues at the very bottom. The story my director would tell finance lived in the gap between those two numbers, not in either one of them.
The first link I built was the wrong one
In the first version of the script I connected the layers with issue links. They were sitting right there in Jira: “relates to”, “is part of”, “blocks”. Two weeks later the report started producing nonsense.
The reason is simple: link types are free. Everyone picks a different one, someone forgets, someone links it the wrong way round. My script was walking five different link types, and the moment an issue in the middle of the chain came loose, all the effort underneath it lost its owner. Sixty person days evaporated under one epic and it took me three days to notice.
In the second version I dropped links entirely. Instead we put a mandatory field on the second layer: Investment Code. It gets filled in when the development epic is created and cannot be left empty. The third and fourth layers do not need to carry it, they inherit it from the epic above.
We also wrote a single rule into the workflow: an epic cannot move into “In development” while its investment code is empty. Free during analysis, mandatory when development starts. That one rule pretty much killed off the manual cleanup the report used to need.
Some issues still ended up with no owner, and my first instinct was to drop them from the report. My director objected, and he was right: orphan rows do not quietly disappear from a report, they get collected under an “unassigned” heading. A report is trusted for saying what it does not cover as much as for what it covers. “96 of this month’s 1,240 person days could not be tied to any project” was worth far more than silently pretending those 96 days never happened.
Where would the person days come from
The tree was standing, but the number it was supposed to carry was still missing. I tried three sources, and all three are flawed to the same degree.
Worklogs. This was the correct one, and also the one nobody used. People did not log time; the ones who did logged it in one estimated batch on Friday afternoon. For a month we tried enforcing worklog discipline from above. The data did not improve, the made up data just got tidier.
Converting story points. I derived a coefficient from each team’s history; on the payments team one point was roughly 0.6 person days. It worked, but I could not compare teams with it, because a point is a team specific unit. One team’s 8 points can be another team’s 3; that is not a defect, that is what points are. In the first version I used a single average coefficient across all nine teams, and that report made two teams look unfairly expensive. Keep the coefficient per team and never collapse it into an average.
Typing in the planned person days. The product manager or team lead writes “this is roughly 40 person days” on the investment item. That number usually comes out of the year end roadmap exercise. Valuable as an estimate, useless as actuals.
In the end I kept both: planned person days at the top, actual person days rolled up from below. What finance wanted was not one number either, it was the gap between the two. YTR-1042 was planned at 40 days and consumed 63. That 58% variance is not a failure, it is information. The day I could point to where the variance came from in the lower layers of the tree, I believed the system was working.
I started with 22 days a month, and it did not hold
When I produced the first full report I had taken capacity straight from the calendar: 22 working days a month. The report showed every team far behind plan. The team leads objected, rightly.
I sat down and worked through one team’s month item by item. Annual leave, public holidays, training, hiring interviews, team meetings, production support, help given to other teams, admin work… Once all of it comes off, a developer’s net monthly output capacity lands somewhere between 15 and 18 days.
Ignore that difference and you set your budget 20% wrong from the start. For a team of 12, the 22 day assumption gives 3,168 person days a year, the 17 day assumption gives 2,448. Those 720 person days in between are capacity you think you have in planning and never actually receive. And the reason teams always look late in the budget meeting is usually not that they are slow, it is this assumption.
There was an argument on unit cost too. Finance wanted cost per person, I proposed cost per team and pushed for it: cost should be held per team, not per person. You set a blended day rate per team; one person day is 18 units on the payments team, 24 on the data team. Per person cost creates a personal data problem, and once the report circulates (and it always does) it leaves a kind of resentment inside a team that is hard to repair. A blended rate is accurate enough and it can be shared.
The report’s real job started in November
I built this as a start of month report. The month it earned its keep, though, was November, not January.
The corporate calendar works like this: every year in November and December next year’s roadmap is put together, effort estimates are produced for the large projects, and those estimates go to finance for approval. And the approval is not only a budget approval. If the effort exceeds the capacity on hand, the resource need gets discussed at that same table: hiring a new developer, bringing in a supplier, pushing a project out by a quarter, cutting scope. How the year will go is largely settled in those two months.
Until then people came to that table with one thing: experience. There was no record behind “this will take us three months”, just a few people who remembered something similar. So the estimate could neither be defended nor challenged.
Once the report was running, every estimate we put on the table in November had two numbers next to it: the plan and the actuals for last year’s work in the same category. “We closed new capability work at 40% variance on average” does not change the estimate, it makes it usable. You can talk about the odds that the item you wrote down as 40 person days closes at 56, right there in the approval meeting.
On the resource side the arithmetic is even more direct. You hold the roadmap’s total effort against net capacity: a team of 12 has 2,448 person days a year, the roadmap is asking for 3,100. Those 650 days in between are either a hire, a supplier, or a scope decision. Discussing those three in November is a very different thing from discussing them in May.
And one more thing happened: the monthly report stopped being a record of the past and became a consistency check on the promise made in November. Because plan and actuals come off the same tree, an item drifting away from its plan did not have to wait for year end. A variance you see in April is feedback on an estimate written in November: a chance to act on that item, and something that accumulates for the next November.
I read the durations out of the changelog
The second half of the report, the status breakdown, was not a money question. Finance was never going to look at that part. It was ours: how long does a request really take from the moment it is opened to the moment it is delivered, and how much of that time is actual work.
There was a “start date” field on the issues. One afternoon I sampled it: half were empty, and some of the filled ones matched the issue’s creation date exactly. Any field filled in by hand starts lying sooner or later. The changelog is the one place nobody can go back and tidy up, so I built the whole duration calculation on status history.
These are the durations the script measured:
| Measure | Definition | What it tells you |
|---|---|---|
| Lead time | Total time from the request being opened to delivery | The time the requester feels |
| Cycle time | From first entry into development to delivery | The team’s real production time |
| Queue time | From opening to the first movement | Too much demand, or a prioritisation problem |
| Analysis time | Sum of the analysis and design statuses | The cost of uncertainty |
| Waiting time | Sum of the waiting and blocked statuses | The cost of dependencies |
I made two mistakes here and both of them reached the report.
First: I calculated cycle time as a single interval. In an enterprise process work comes back; it drops from UAT to development, goes to test again, drops again. Because I measured from “first entry into development” to “final delivery”, I had counted every waiting period in between as development time. One of the team leads killed that number in a meeting with a single example. The right way is to add up the time spent in each status cumulatively: if the work entered the development status four times, the sum of those four is the real development time.
Second: I had not subtracted cancelled and frozen periods from the raw duration. After that I kept two separate lead times: raw lead time (from opening to delivery, everything included) and adjusted lead time (cancellation, waiting and post delivery periods removed). And the story worth telling upwards usually came out of the difference between them. “This request took 94 days, but 41 of them waited on our side and 53 went into supplier approval” says far more than the number 94 on its own.
Looking only at closed work misled me
The first version of the script collected closed issues only, because I needed an end date for the duration calculation. The report it produced made the process look faster than it was, and for a while I was pleased with it.
Then it hit me: closed work is by definition work that was able to finish. The hard ones were still open and never showed up in the report at all. Left unmeasured, that illusion grows month by month.
The fix was simple: calculate durations for open issues too, using today’s date instead of an end date. So next to “average delivery time is 38 days” the report also carried “61 issues are still open, average age 112 days”. In meetings the second sentence got far more airtime than the first.
Finance’s three questions came out of the same data
Once the tree was standing I could see that finance was really asking three questions, and all three came out of the same data.
What did we spend. Total person days times the team unit cost, summed per investment item. That is the top line of the report.
Where did it go. This is where the breakdown matters. We split investment items into categories: roadmap work, unplanned requests, work carried over from last year, mandatory compliance work, and maintenance. Without that split you cannot write a sentence like “60% of the technology budget went to the roadmap”; and when that sentence cannot be written, the budget discussion runs on feelings instead of numbers.
Can it be capitalised. This was the most sensitive question on the accounting side. Building a new capability can usually be capitalised, while maintenance and bug fixing get expensed. I first tried managing that distinction with labels and it failed comprehensively: a label is free text, and within six months it has ten spellings. The right way is a closed list investment type field on the investment item, inherited by the layers below. If an exception is needed it is marked explicitly, and the inherited value stays the default.
There was also a period allocation problem, and I noticed it in the very week I was due to send the first report. One of the lines my director wanted was “which project closed in which month”, and in the first version I had booked the cost to that month as well. That was wrong. The closing month is one piece of information, the month of the cost is another. Cost belongs to the month the effort was spent, not the month the work finished. A project that started in January and finished in June is not a June expense. With worklogs this solves itself. Without them I used an approximation: take the time the issue spent in the development status, split it across months, and distribute the person days in the same proportion. Flawed, but far better than inflating June with one lump.
The report did not agree with payroll
I took the report to my director, and the first thing he did was compare the number against payroll. That is the only practical way to test whether a Jira report is true.
The team was 10 people, net monthly capacity was 17 days; so about 170 person days were expected from that team during the month. My report showed 118. I had to explain the 52 days in between.
I spent a week talking to the teams to find where they went: production support that never got an issue, help given to another team, meeting and analysis time nobody recorded, and the small jobs everyone does and nobody logs.
Instead of hiding that gap we gave it its own line in the report: “Unrecorded capacity: 31%”. In the first month it was uncomfortable, in the second it started an argument, in the third it began to drop. Left unmeasured it never drops at all.
What we actually built inside Jira
The Jira side of this whole story turned out to be surprisingly plain. These fields were enough.
| Field | Where | Type |
|---|---|---|
| Investment Code | On the development epic, mandatory | Issue link field |
| Requesting Department | On the investment item | Closed list |
| Investment Type | On the investment item | Closed list |
| Category | On the investment item | Closed list |
| Planned Person Days | On the investment item | Number |
| Team | On the task | Closed list |
Beyond the fields there were two structural decisions.
Status schemes have to be shared, or at least mappable. With nine teams each building their own workflow, durations stop being comparable. Teams having their own intermediate statuses was fine, but we required every status to map onto a common phase: queue, analysis, development, test, waiting, done. The script ran on phases, not on statuses. When a team added a new status the report did not break.
A closed list always beats a label. No label managed field survives two years. We had Roadmap2026, roadmap-2026, RM2026 and Roadmap_2026 all at once, and in the first version I wrote code to merge them. Moving to a closed list threw that code away, and good riddance.
Not one report, two
The first output of the script was a single page with everything I had found on it: project, person days, status durations, variance, all side by side. My director looked at it and said: “This is a table, not a report. Finance cannot get its number out of this.”
He was right. There had been two readers from the beginning and I was trying to serve both on one page. I split the output in two.
The finance layer, one row per project. Project, owner, category, closing month if it closed, planned and actual person days, variance. No status names, no durations. Thirty or forty rows, one screen. That was all finance needed.
The IT layer, the epics and tasks under those same projects. Each row carrying how long it sat in which status, how many times it bounced back, which team owns it. We never sent this layer to finance, we used it ourselves.
And the condition binding the two is this: the reason behind a variance in the finance layer has to be findable in the IT layer in at most two steps. The day “why did YTR-1042 take 63 days” could be answered with “because epic ODM-3310 came back from UAT three times and sat 22 days in waiting”, the report started doing its job. If it cannot be found, you do not have a report, you really do have a table.
What I call mistakes looking back
Turning a measure into a performance score. A few months after the report started working, the proposal I had been expecting arrived: show cycle time per person and feed it into performance reviews. I pushed back then and I would say the same today. The moment cycle time is measured per person and enters an appraisal, people start managing Jira. Issues get closed early, work gets chopped into small pieces to inflate the count, hard work gets done without an issue at all. From that point on your data measures people protecting themselves from the report, not the process. A measure is a measure of the process, not of the person. Every system that loses that distinction starts producing dead data within six months.
A setup that is perfect for one team and useless for the company. I ran the pilot with a single team and it worked beautifully: fields filled, durations clean. When I opened it to the other eight it turned out they had nothing in common with that team. Only a small number of things need to be shared, and those have to be set centrally; on everything else teams should be left alone.
Leaving a manually filled column in the report. I left two columns to be filled by hand, telling myself I would automate them later. Three months later both were empty. If a piece of information has to be typed in by a person, its place is the issue, not the report.
Trying to fix history. My first instinct was to clean up the last two years of issues. I spent two weeks on it and got nowhere. The right move is to set a cut off date and add up everything after it correctly. A rough estimate is enough for the past; nobody genuinely wonders about person days from three years ago.
How it ended
The first report went out on the third of the month, and so did every one after it. It was no longer an Excel file someone sat down and wrote; it was two pages that rebuilt themselves at the start of every month, and for any number in them you could show which issue it came from.
The whole thing came down to one sentence: build a bridge between the unit finance speaks in and the unit teams work in, one that nobody fills in by hand. Once the bridge is there, person days, lead time and the capitalisation report all fall out of the same data. Without it, the same Excel gets rewritten every month and nobody trusts it.
If you have seen an enterprise setup where this bridge exists, or you have tried a different breakdown, I would like to hear about it.